Displaying Data: The Right Tools for the Right Job

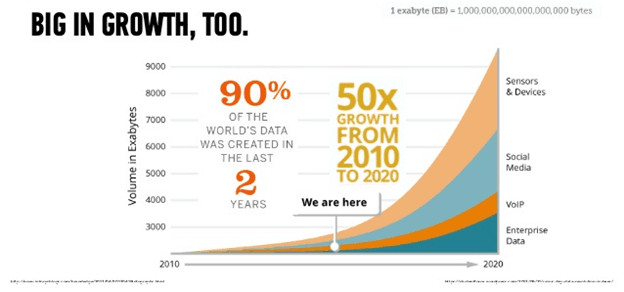
Did you know that over 90 percent of the world’s data was created in the last two years? The growth in mobile devices, apps, and the countless sensors tracking all the “things” is generating extraordinary amounts of data, and like a moth to a flame, we are flocking to this data to glean insights from it and influence the way we live. In many cases, we end up using the wrong tool simply because it’s the tool we use on a daily basis. “When all you have is a hammer, everything looks like a nail!”
A Short History
Over the years, the way data has been displayed to help us present information has had many names; reporting, business intelligence (BI), data visualization, and on and on. Based on my previous experience, since 2001, working for a BI platform software company and developing automated reporting tools, I’ve bucketed displaying data into six categories:
1. Tabular reporting – Row and column data extracts, spreadsheets, or paginated data on paper or PDFs. Data comes straight from a database, a view, or copied, pasted and manipulated into output display format.
2. Pixel-perfect reporting – Formatted reports like financial statements, invoices, bills, or general information statements which may include elements of tabular reports, charts, and graphs to convey information in a static and structured manner.
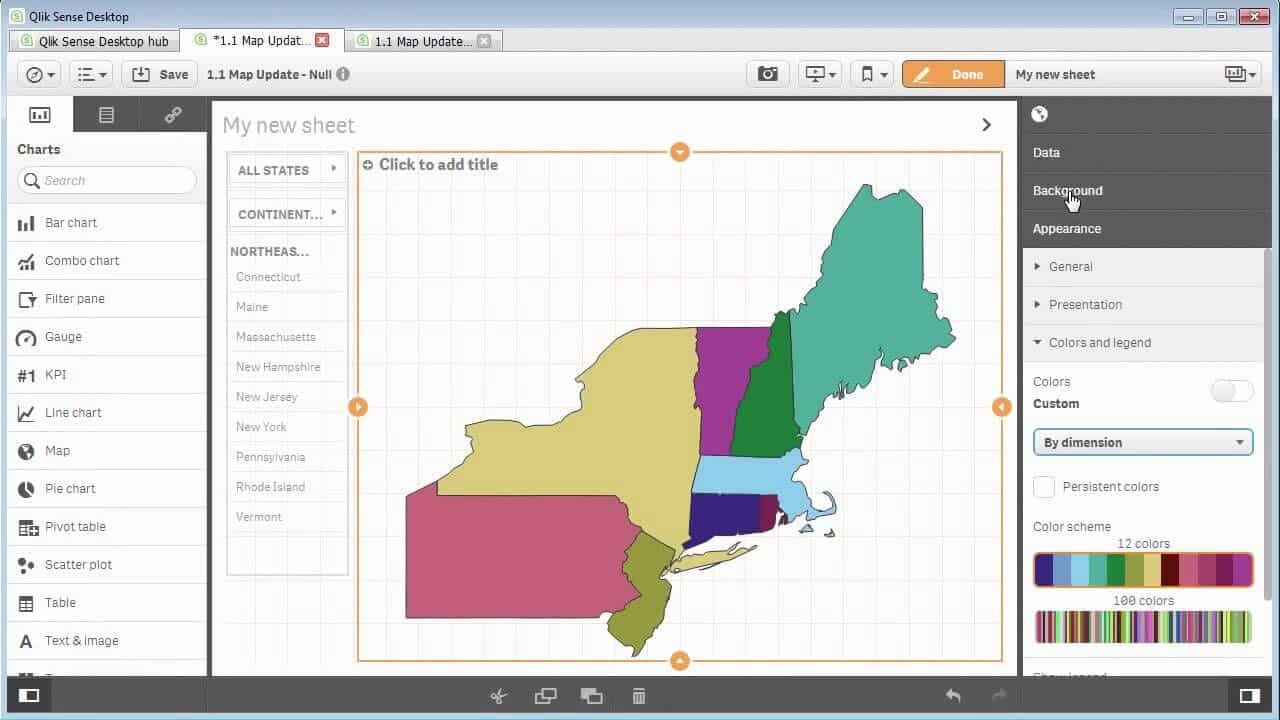
3. Guided analytics – Guided analytics are purpose-built dashboards created by BI analysts responsible for building data models and interactive user interfaces. Users consume data through charts and graphs (termed visualizations), tables, and other objects fit a custom layout.
4. Self-service analytics – Self-Service analytics marks the democratization of the guided analytics development process to the end user. With these tools and platforms, the end user is able to create a dashboard from scratch adding data from multiple sources and creating visualizations from a user interface employing intelligent data preparation and assisted chart creation capabilities.
5. Embedded analytics – Embedded analytics give front-end developers the ability to use HTML 5 and JavaScript to generate robust and interactive visualizations with code and placing them directly into web pages and applications.
6. Advanced analytics – The future of analytics has never been brighter. Because the amount of data in the world keeps growing, we need more help getting the information and insights that matter. Artificial intelligence, machine learning, cognitive analytics, bots, conversational UIs, and more are technologies making it easier for anyone to harness the power of data to improve their lives.
The minimum we should hope for with any display technology is that it should do no harm”. – Edward Tufte
The Challenge
As displaying data (what I call BI) continues to evolve and change – a problem remains. The demands on the tools and platforms are greater than the capabilities they deliver. BI consumers want more than “what’s happened” and “what if” analysis from these tools. They want a full lifecycle application that takes history into account and enables immediate impact on the future. It’s the true promise of insight to action, but from a single interface; visual or otherwise. In order to meet this requirement, BI developers are needing to learn how to code.
During my experience working in BI, I talked to many analysts trying to build general purpose apps using only their BI platform’s APIs, and it didn’t make any sense.
The challenge of learning the BI-specific APIs is hard.
Combine that with having to learn general coding, and ultimately the investment and effort are not worth the value returned. That’s why low-code is a better way for BI developers to deliver complete apps with capabilities beyond BI and visualization. It’s easier and more powerful than trying to code using BI APIs, or integrating tools needed to perform operations that BI tools don’t (e.g. write back to the BI dataset). The irony is that application developers are trying to do the same thing in the opposite direction.
Since joining Mendix, I have had multiple conversations a week with customers about using low-code to develop a reporting or BI-like application, where the end user can perform a number of the functions available in the categories described above. The development goal is the same as the BI developer. Build a complete app that delivers the power to convey information meaningfully; do something with it while supporting updates or changes in the data; provide end users analytical flexibility.
Considerations for Using Native Charts in a Low-Code Application
The basic premise for application developers when it comes to reporting, BI, analytics, etc., is not to reinvent the wheel. Stick to the basics and display the data that will help the end user get to the next step in their experience. The charting and reporting capabilities (through list views and data grids) are fine for displaying meaningful data relevant to the task the user wants to accomplish with the application. Trying to make available all the data at runtime for users to do whatever they want is not the right fit. Consider asking these three starter questions when trying to decide what to do:
1. What is the problem you are trying to solve for the user?
Think about the use case and the way information needs to be conveyed to the user. If the customer wants to have a set of key performance indicators (KPIs) on an app homepage or somewhere throughout the user experience, using the charts and graphs included in a platform like Mendix makes sense because you can create beautiful and useful visuals quickly and easily. If the customer is asking for all sorts of self-service capabilities during application runtime, it’s time to consider an integrated platform that satisfies the requirement.
2. How much data is in your application?
Does the application have 100 rows of data or 100 million rows of data? If it’s the latter, presenting all that data in detail returns significantly less value than the time it takes to render in the application. When designing apps with dashboards and charts containing significant volumes of data, get prescriptive and restrictive with aggregations for KPIs, charts, and list views using filters and conditional logic. Your users will thank you for shortening their time to insight while increasing the value of what is being displayed.
3. What level of interactive analysis is required?
Because of the interactive nature of guided and self-service analytics, end users have become accustomed to clicking on charts and graphs and having that action apply a filter to the dataset. However, the ways of working with these tools are changing, and in many cases, the desired response to a click or interaction is to perform an action. These actions may include a drill-down (going from one layer of data to another), opening a new screen in an application to show more detail or solicit input, or to assign a specific record to a workflow or person triggering a notification or alert. All these activities require logic combined with the visual to take the next step, and low-code platforms provide intuitive ways to ease the configuration of these actions.
Conversely, low-code developers may receive a requirement to connect the data presented in the charts that is easier to do on an analytics platform. While it is possible to connect a group of charts together to respond in unison to an interaction with Mendix, it is important to weigh the effort against the desired benefit, maintenance, and scale of the solution. In many cases, integrating a platform purposefully built to handle this level of complexity makes more sense.
Considerations For Using a BI Platform Embedded in a Low-Code Application
There are many reasons to integrate reporting and BI platforms into low-code applications. For starters, your organization has made a sizable investment in BI and you should take advantage of it. Transaction-based systems in applications aren’t designed to handle the analysis requirements BI platforms address using their proprietary data engines, so there is a definite advantage to BI when your users need to slice and dice data. In addition, both BI platforms and low-code application platforms have exposed APIs to facilitate communication at the various layers of their respective stacks. This makes it easier to create hooks on the BI side, and reusable components on the low-code side to combine the power of both technologies. Here are some questions to consider when trying to embed business intelligence and analytics into applications.
1. Is the data coming from multiple sources?
Both low-code platforms and BI platforms have robust ETL, data processing, and transformation capabilities. Here are some things to think about:
- If one platform is performing the data blending and can supply what the other needs, the level of effort to recreate it in the other system may not be worth it.
- If a decision on which platform to use for data blending needs to be made, pick the platform for whom the people who understand the data best can also understand the tool best. The great thing these days is both low-code and BI platforms have the APIs to talk to one another.
- Avoid processing data on both platforms to support the use case. Doing so introduces data quality risks and makes it harder to trace potential errors in calculations or track data lineage from end to end.
2. Do end users need self-service capabilities to select the fields of data they wish to view in a grid, output or to create visualizations during runtime with the underlying data?
If my previous statements aren’t clear enough, don’t build self-service reporting and analytics tools with any application development platform unless your goal is to build the next great tool. There are plenty of options in the marketplace that can satisfy one or more of the categories I described, and many have options to white label the solution so customers will think it is your own. Save time and money, and prevent developer burnout.
3. Do metrics derived in BI platforms need to trigger events, call application logic, write to underlying data sources, and refresh the BI visualizations?
In the world of BI today, in order to move beyond analysis and into action within the same platform, you have to code your way to the solution. This can be time-consuming for experienced software developers and a non-starter for BI analysts who are trying to solve the problem. Low-code application development platforms make it easy for anyone to create robust applications using visual logic (think Visio, but the flows are interpreted into action) to drive the interaction of the user interface and process back-end activities. Pairing low-code with embedded analytics tied to a BI platform delivers the best of both worlds. You can take advantage of the connectivity and interactivity the analytics platform provides, and use a low-code platform to handle the data processing and operations logic of the application life-cycle.
There is no doubt about the convergence of these two technologies. As the demand for applications grows, the demand to interpret and present the data they generate grows even faster. Low-code platforms have the chops to handle a number of reporting and charting use cases. As the requirement for the time it takes from insight to action to review and around again becomes shorter and shorter, more sophisticated solutions leveraging analytics and low-code need to be considered to help deliver the best of both worlds.