
Every app you run in the Mendix cloud is automatically provided with out-of-the-box monitoring. In the Mendix cloud, you can see trends for key metrics of your application, all the log events generated by your application, and see and receive alerts for different types of checks.
Sometimes, however, you need extensive monitoring, especially if your Mendix app is part of a heterogeneous landscape of software and you need one integrated monitoring solution. Or if you need to monitor many Mendix apps in a microservices architecture.
Several Mendix developers have indicated that standard Java monitoring isn’t providing the information they need to improve their apps. We get it: you want to know how your microflows and activities are performing. This is why we are now introducing Datadog monitoring for Mendix applications: enterprise-grade monitoring for low-code. As of Mendix version 7.23, you can monitor your Mendix apps using Datadog.
Why Datadog?
Datadog is a SaaS monitoring product we see used by a large number of our customers. Datadog is a leader in the Forrester wave for Intelligent Application and Service monitoring. Here’s a quick summary of Datadog’s capabilities that match well with the requirements we’ve received from Mendix customers:
- The ability to monitor Mendix model concepts – in Datadog you can see metrics for microflows and services you’ve created in Mendix, and for all the activities which are part of your microflows.
- The ability to monitor application metrics – many customers have expressed the desire to monitor Business key performance indicators (KPIs) and service level objectives (SLOs) as part of their monitoring solution.
- Consolidated logs so you can see what happens when logic is executed by multiple dependent applications.
- Powerful and configurable alerting – the ability to define alerts on custom searches, based on thresholds, outliers, or expected trends of any metric in the log files, be it infrastructure resource metric, Mendix model metric, or application level metric.
- Landscape view – a way to quickly understand the health of a large number of apps. Datadog provides different, customizable, views of your landscape, from servers to containers and process level.
- A simple monitoring experience – all observable aspects, metrics, logs and traces, relevant to monitoring your application are available in one integrated solution, with built-in navigation to go from one aspect to another. For example, if you see a peak in a trend graph for some metric, it’s a one-click action to pull up all relevant log events. Having complete and integrated observability is key to reliably operating a microservices solution.
Datadog has certified its compliance with the EU-U.S. Privacy Shield Framework and is a STAR Registrant for the Cloud Security Alliance. Datadog also pursues key independent third-party validations of its security, processes, and services, including completion of the SOC 2 Type II audit.
What does the integration look like?
Core to the monitoring integration for Datadog is an open protocol called Statsd. This protocol offers a lightweight, extensible way of pushing metrics to monitoring agents. The Mendix runtime has built-in support for Statsd metrics. The platform uses this to provide out-of-the-box metrics for everything in your application like microflow execution, microflow activity execution, endpoint calls, number of objects allocated in memory and more.
However, we’ve also included a metrics API in the runtime so you can use it in your own applications like, for example, business SLOs and KPIs.
The use of Statsd offers an important benefit over monitoring tooling which focuses on Java monitoring. Statsd enables Mendix to provide insight at the low-code model level. This means that the information is directly of use for developers using Mendix. Compare this to Java metrics, where Mendix developers do not understand how Java or Scala information relates to their app model. With Statsd, we can tell you how often and how long your microflows and services are executed, so that you immediately know what your application is doing.
When you enable Datadog for your application, by providing a Datadog API key in your custom application settings, an agent will forward all Statsd metrics to Datadog, in addition to systems metrics and logs as collected by the agent.
The monitoring solution can be thought of as a large time series database with some out-of-the-box and configurable dashboarding and charting on top. To make sense of all the metrics received by Datadog, they are enriched with additional information like hostname, type, and tags.
The Mendix platform provides a number of these tags out of the box, like microflow name, activity name, or endpoint operation. You can also provide your own tags for application and business metrics. This enables you to:
- Exactly pinpoint the origins of a metric.
- Group and filter metrics in your dashboards to focus on a specific subset of your systems or functionality.
How do you use it?
Landscape health
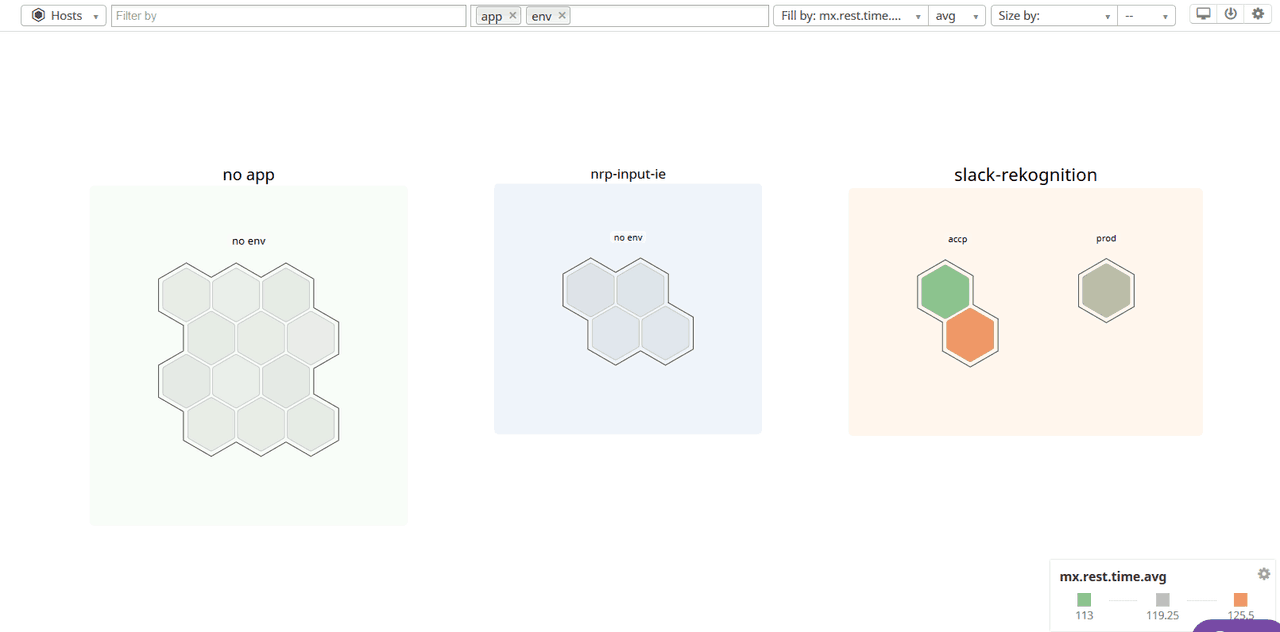
The first thing you will probably want to see is the status of your app landscape. Datadog provides an infrastructure view which gives you a high-level overview of all your Mendix instances. From here you can drill down into specific app instances when you notice something which needs attention.
The following overview shows all running app instances. This overview has been configured to group hosts by application and environment. This can be achieved by defining app and env tags on your Mendix environments. The colors of the instances are configurable, in this case, they indicate the average duration of rest APIs of a particular instance.
Resource monitoring
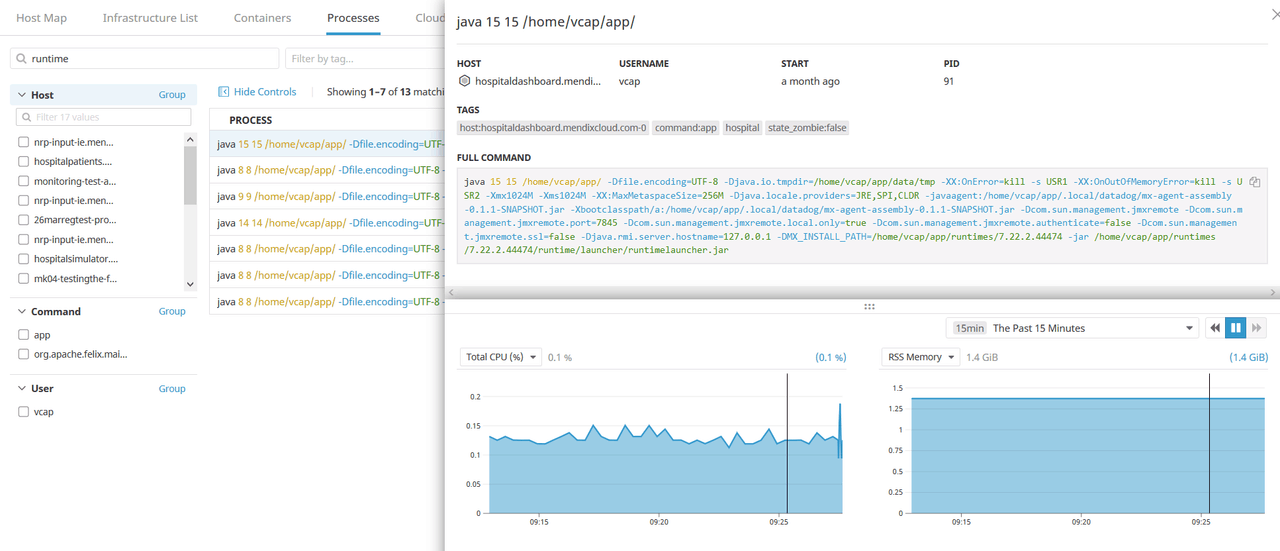
If you need more details, you can get process information for all processes. Here you can filter on a specific process, for example by name, and get specifics of resource usage by process. The following image lists all Mendix Java runtime processes and, for the selected process, CPU and Memory trends.
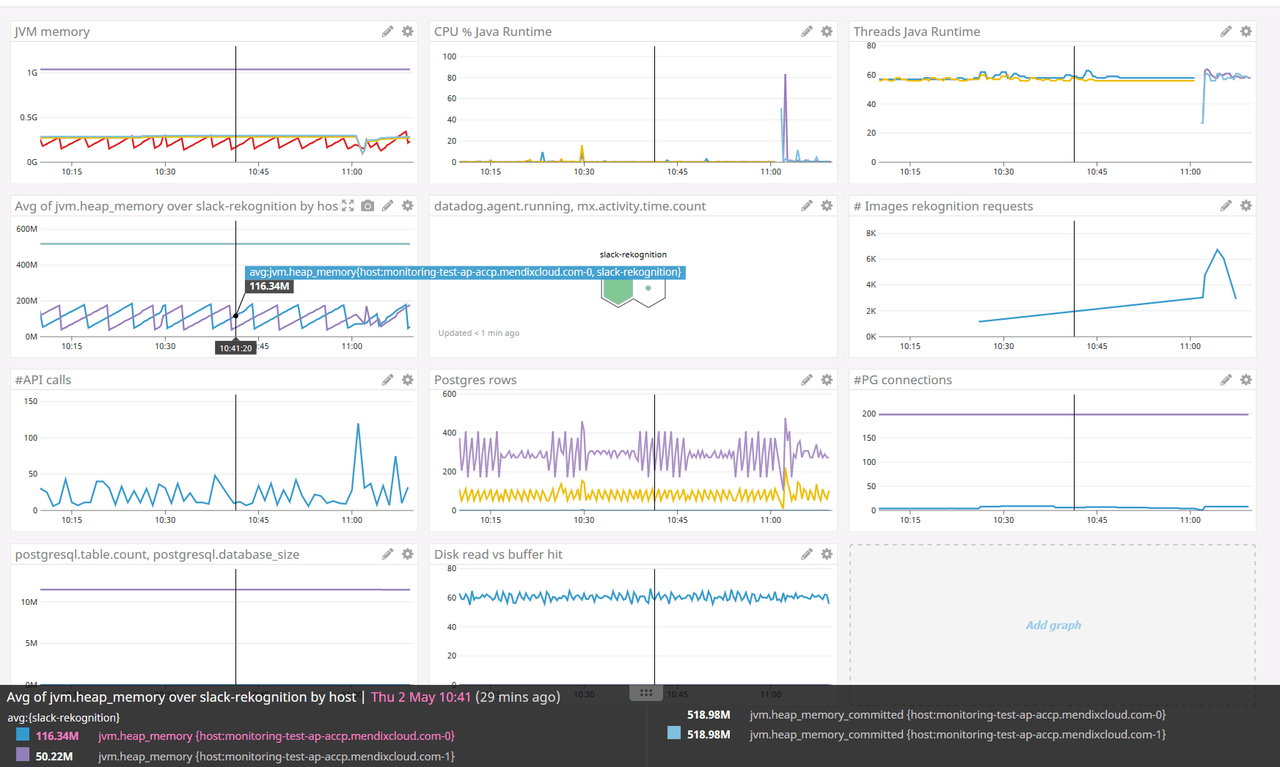
Alternatively, you can build your own dashboards based on available metrics. Dashboards come in two flavors, Timeboards and Screenboards. Timeboards present the metrics in a time-synchronized way, so it’s easy to compare different charts and metrics.
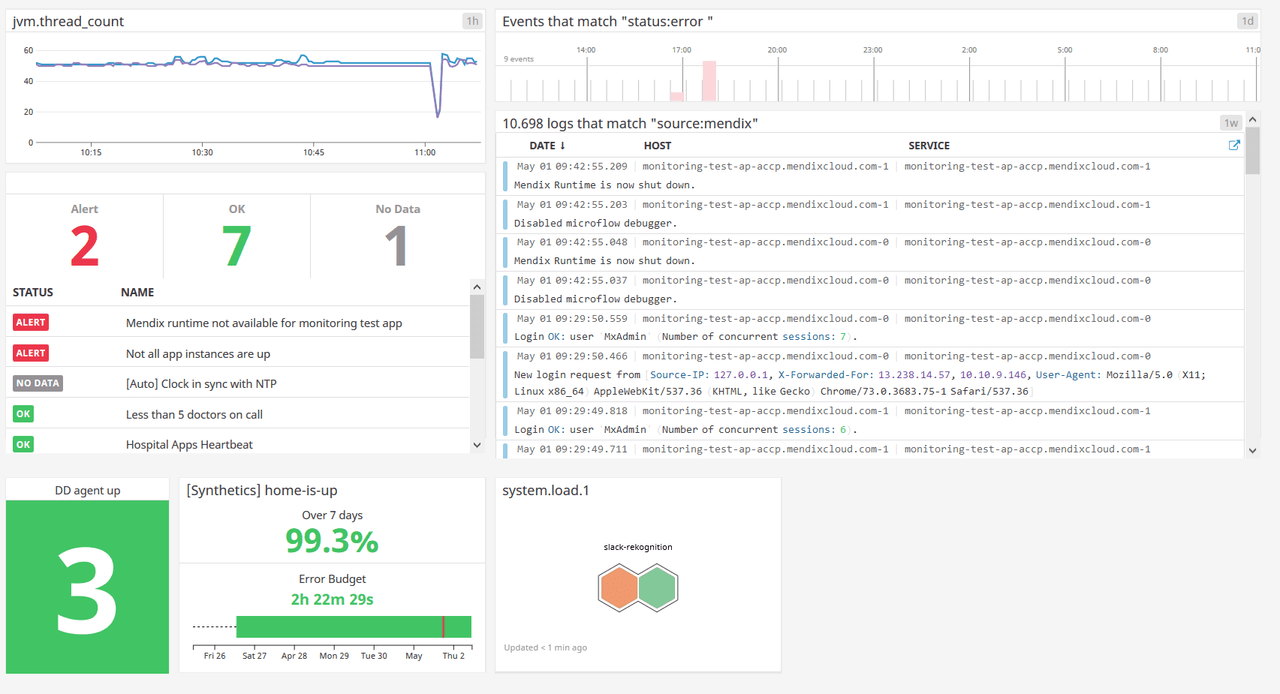
Screenboards enable you to mix different types of widgets, charts, alerts, and even loglines.
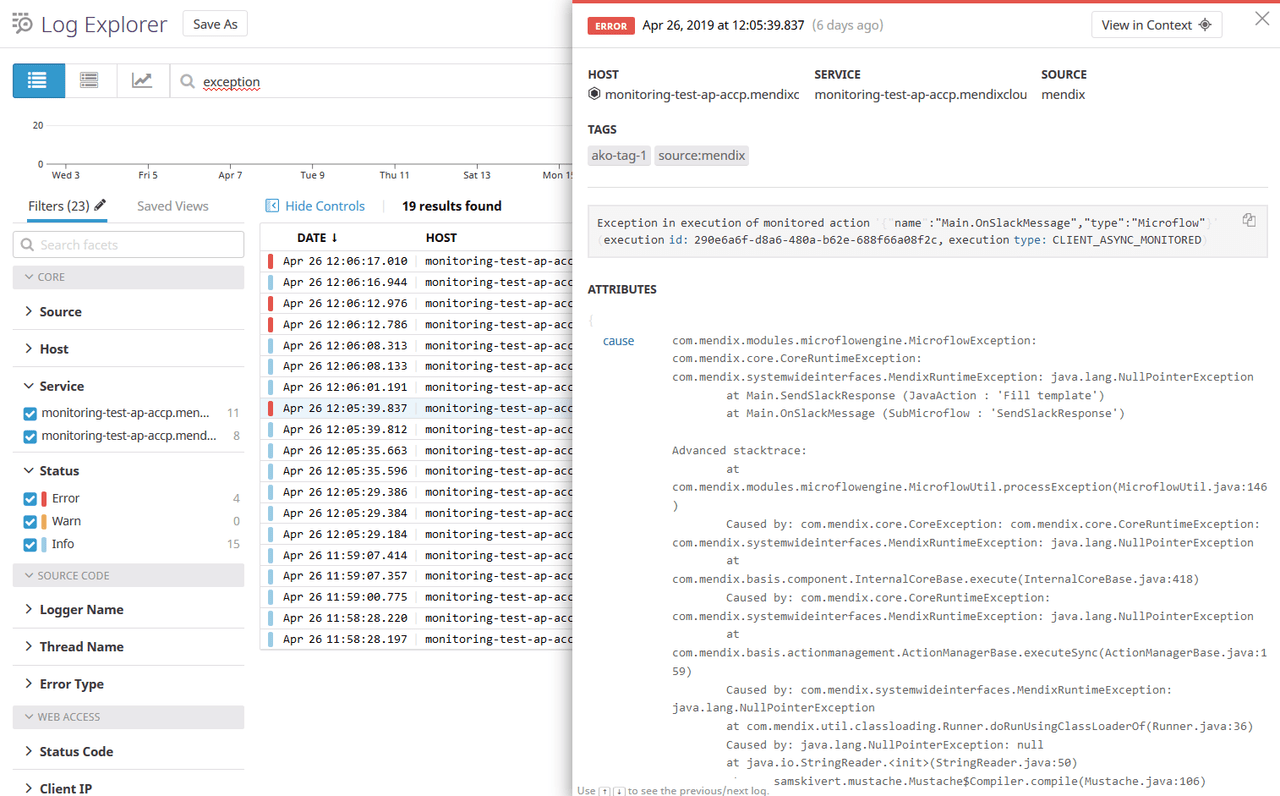
Logs
Datadog consolidates all your app log events. This means that from one single interface you can search through all your logs across all of your apps, filtered by hostname, appname, severity, or lognode. You also have views to tail the newest log events, or detect patterns in your logs.
App metrics
Metrics can be generated by any component in your landscape. Obvious metrics are infrastructure components like databases or processes like Java processes.
Mendix also offers the possibility to define your own application or business metrics. You can use this to build a SLO or KPI dashboard for your application or landscape.
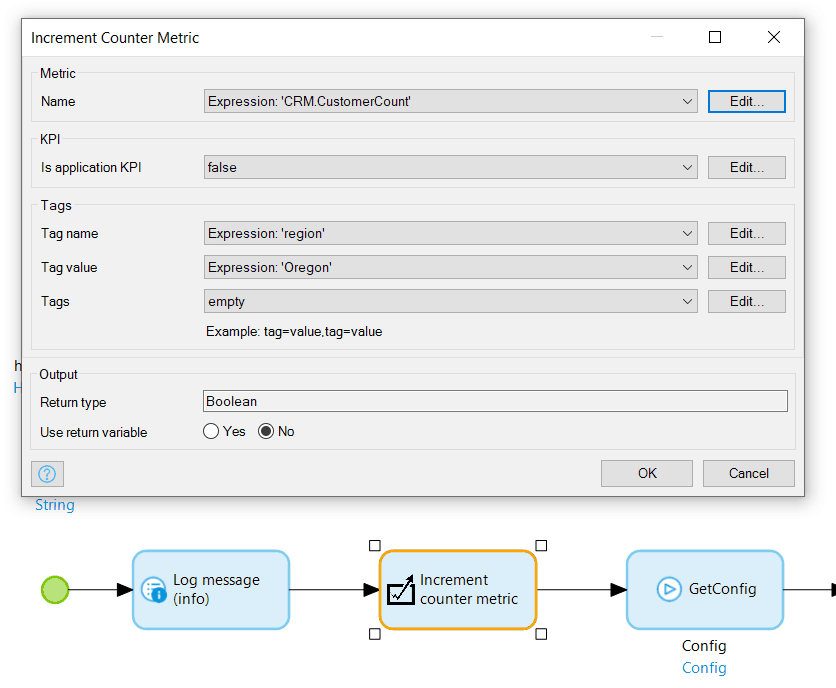
The Mendix App Store connector is available, too, allowing you to add metrics to your application. The activity illustrated in the image above will increment the ‘CRM.CustomerCount’ metric by one. The metric also includes a tag named ‘region’, so you can segment your dashboards by region.
When you send custom application metrics to Datadog, you will be able to setup Dashboards where you can track how well your application is doing for these business metrics.
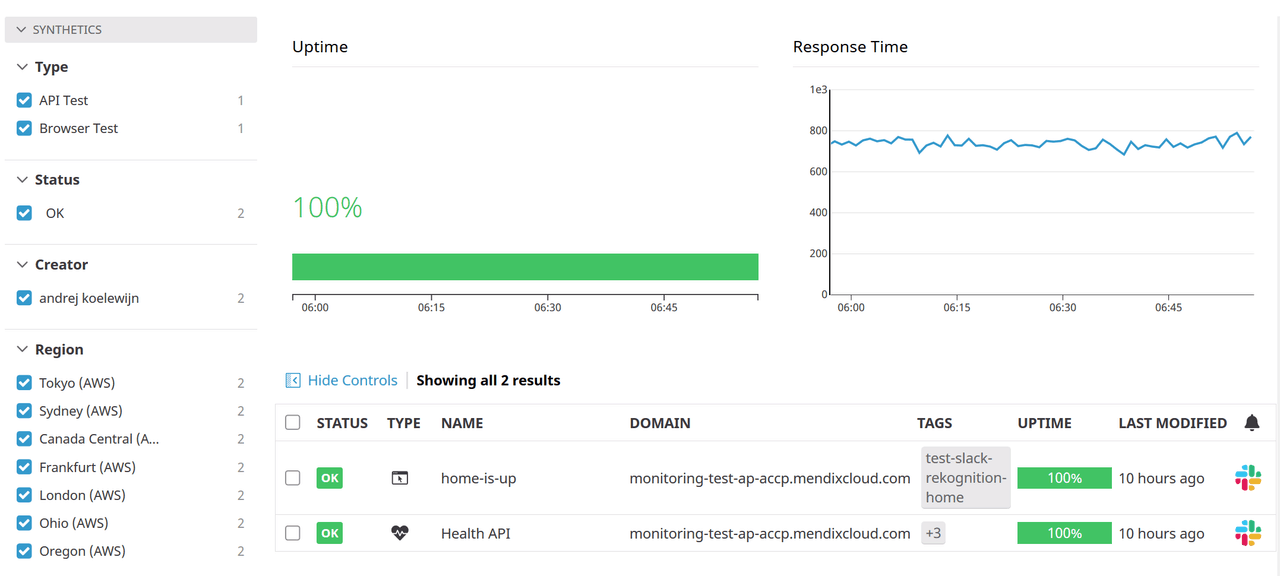
Availability
Datadog also provides you with a way to define end-user tests and have these run regularly on your applications. You can do this for web pages by recording a number of steps in a browser. For API calls, you can define the API URL to be called, and assert outcome, http status code, and header values. These test cases will be executed by Datadog periodically from different global locations. This gives you an overview of how your application is performing for users around the globe.
Alerting
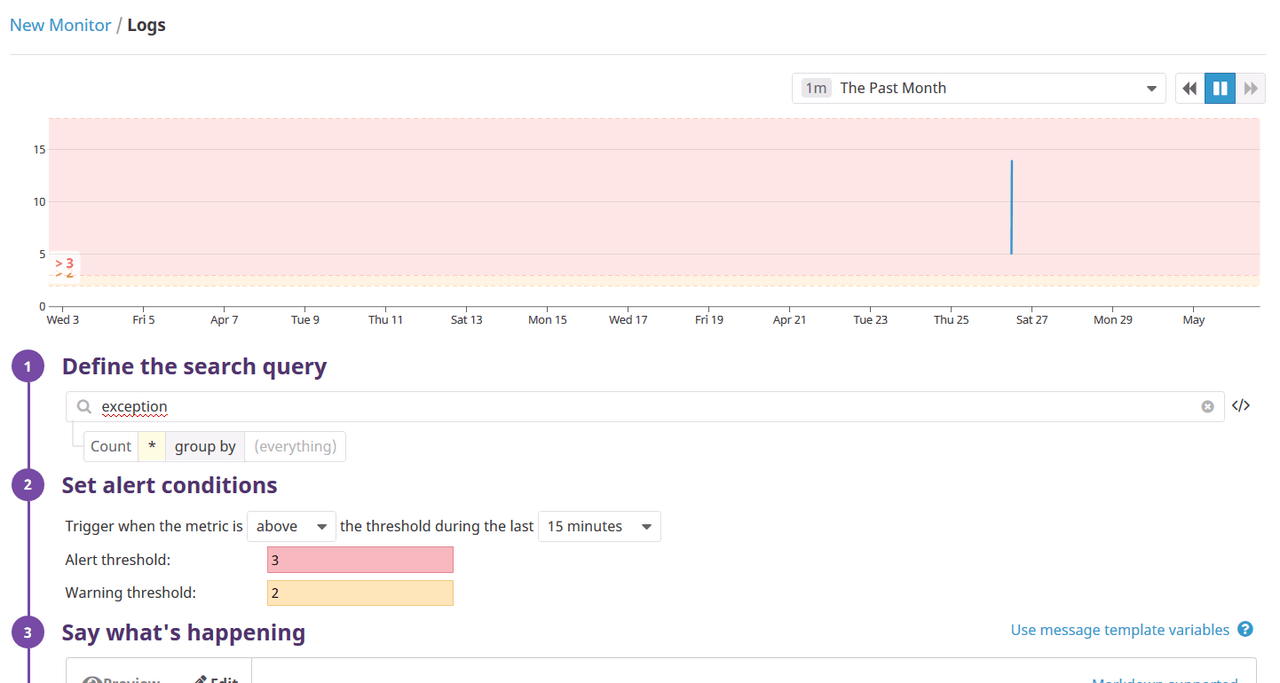
Datadog offers a very powerful and flexible way to configure alerts through Monitors. Monitors can use data from different sources, like metrics, host information, and resource usage, but also logfiles. You can trigger them based on basic thresholds, but also in more complex ways, like anomaly detection, forecasts based on extrapolation, or even searches on your logfiles.
As an example, you can define a monitor to receive an alert whenever an exception is found in your logs. The configuration below specifies that we want to receive a warning when two exceptions are found within a 15 minutes time frame, and an alert when three or more are detected.
Mendix performance monitoring
A key to monitoring a low-code platform is that you need to understand timings for microflows, activities, and services.
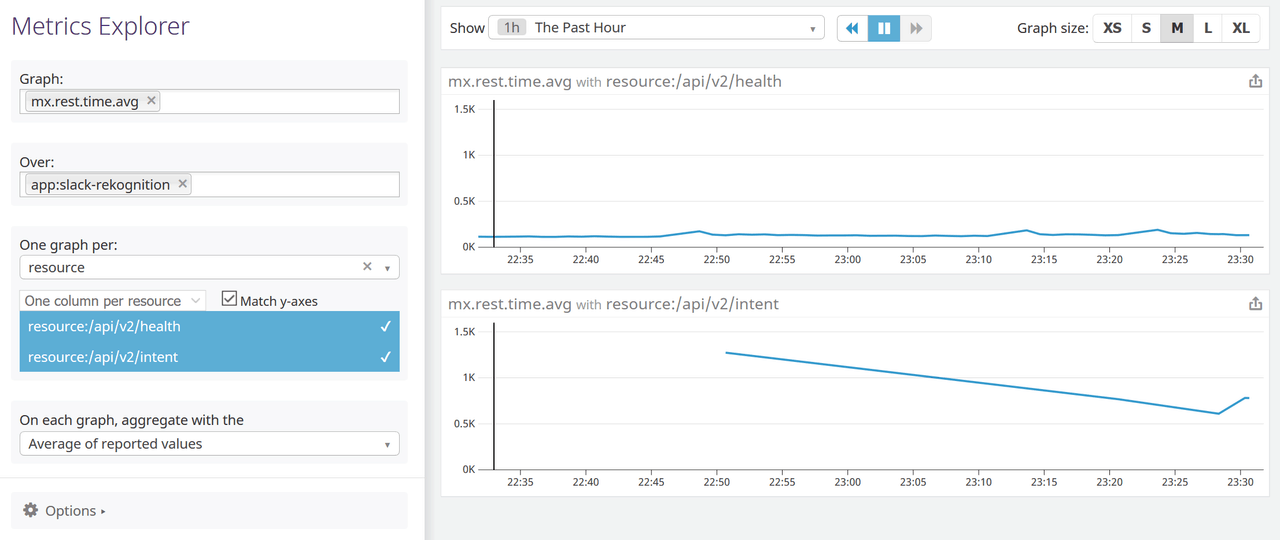
In the following section, we show you how you can monitor rest endpoints. In this example we want to plot the average duration for two rest endpoints in a specific app.
How to get started
We can tell you’re excited, so here’s how you can configure these metrics for your apps.
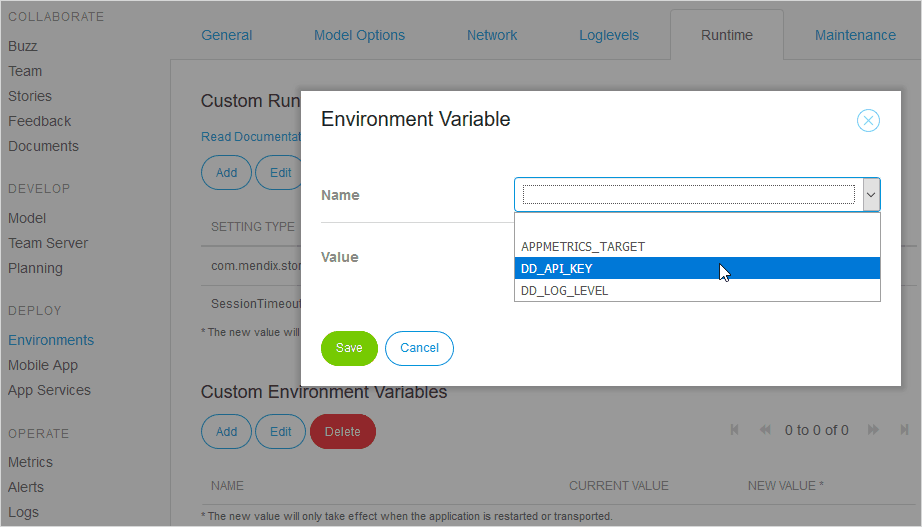
Monitoring your Mendix apps with Datadog takes just one simple action. To start sending monitoring metrics from your Mendix applications to Datadog, you need to provide a Datadog key in your app custom settings. If you don’t have a Datadog account you’ll first have to sign up for one, for details see our notes on Datadog metrics.
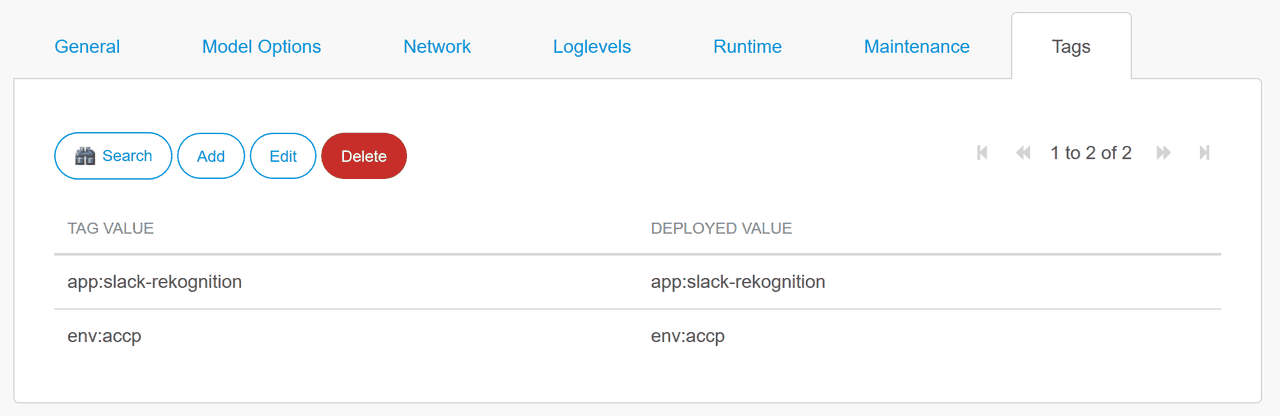
Next, you can add some default tags to an app deployment, to ease finding the right metrics in Datadog. A good best practice is to at least have tags to indicate the app and the environment, as illustrated below.
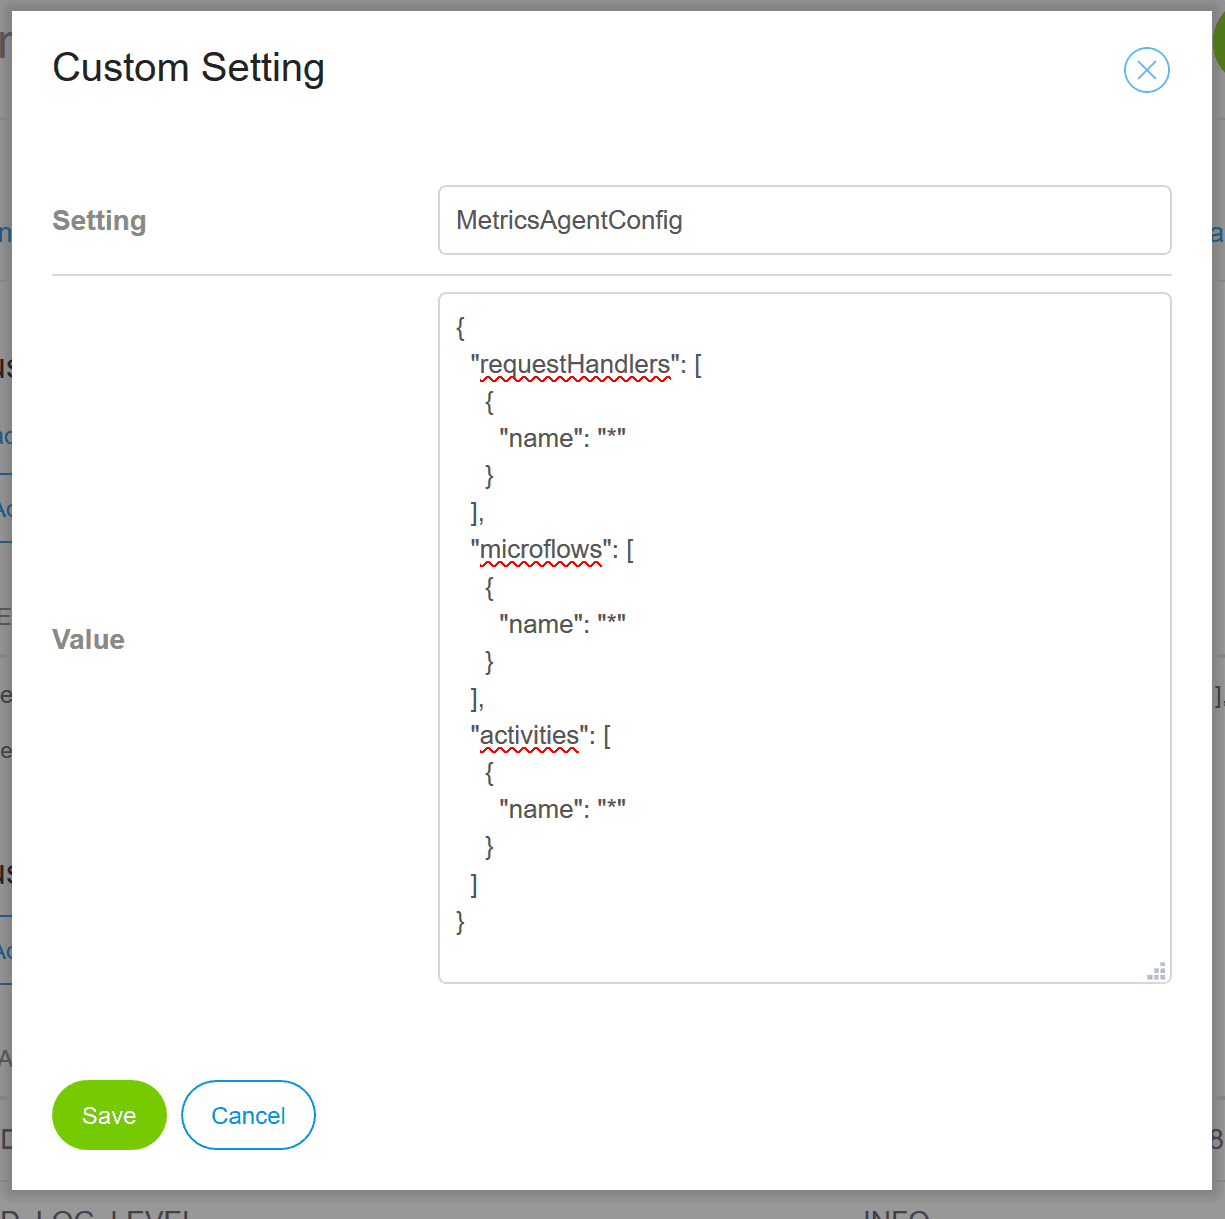
To collect duration metrics on your microflows, activities and service endpoints you can use the MetricsAgentConfig custom setting. This enables you to either instrument all microflows, activities, and service endpoints, or to specify by name what you want to instrument.
Enterprise-grade low-code
Monitoring low-code applications has never been this powerful! Through our deep integration, you get all the monitoring you need to run your enterprise-grade no-code and low-code applications.
Don’t have a Datadog account? Go create one!
Have a Datadog account but need to generate an API key? Go make one!