Put a Pretty Face on That Dull API
I bet in your enterprise, there are a few back-end data APIs with some useful information but no great way to visualize it, understand it, and possibly even make it actionable. Recently, my colleague Tyler and I were challenged with just such a scenario.
We had a customer-facing event coming up with a theme based on a certain big college basketball tournament that occurs annually in March (name withheld due to licensing restrictions). Could we build a compelling user experience in Mendix, in just a few days, with only the data from this Sports Feed API??
The Premise
There would be four basketball games going on during the event. All participants would be able to make a prediction on who would win the game and what the margin of victory would be. A perfect score would be 100 if you selected the winner and the exact margin for each game. Picking the wrong winner would get no points, and picking the winner but the wrong margin would generate a percentage of 25 points, based on how close you were.
The app would consist of the following functions:
- The ability to register with an email address and upload a selfie.
- A list of games and the current score.
- The ability to make a prediction on each game.
- A view of the live leaderboard, which updates every time the score of a game changes.
- The ability to see the breakdown of points earned by game for each participant.
The event was at a local pub, and no one would have laptops handy. This meant a mobile experience was the way to go. We also knew that the app would be used very briefly. No one wants to download an app that you only use for a couple of hours. Also, since we only had a few days to complete the app, a native app that would need to be published to an app store was out of the question.
This led us to a Progressive Web App (PWA) approach. You can read all about how Mendix lets you build PWAs here.
…and full PWA documentation here.
Another interesting twist was the suggestion to have an animated leaderboard that would dynamically shuffle the leaders to the top in real-time. Although there isn’t an out-of-the-box widget for this, the extensibility of Mendix’s React-based framework allowed us to build one.
While I worked on the app UI, my colleague Tyler put together the leaderboard.
Here is Tyler’s description of developing the animated Leaderboard:
Utilizing the Pluggable Widget Generator, it was no big deal to put the leaderboard widget together for this project. Because Mendix widgets rely on the React framework, it’s possible to incorporate any of the thousands and thousands of React components that are readily available. In this case, knowing that we wanted the leaderboard to animate when the scores changed, we settled on the React Flip Toolkit to handle the heavy lifting for us.
To generate the effect we wanted, all we had to do was plug in the Flipper and Flipped components from the Flip Toolkit into the widget template provided by the Pluggable Widget Generator, and we were ready to go. Throw in a little xml to specify the properties we wanted to expose to Mendix Studio Pro, and that was it—a custom animated leaderboard widget was ready to deploy with minimal effort.
You can read all about the details on building pluggable widgets here.
Using Mendix Team Server, Tyler and I were to collaborate on the development, submit feedback ideas and track all of our changes while seamlessly deploying to our Acceptance and Production environments. You can read more about Team Server here.
The Build
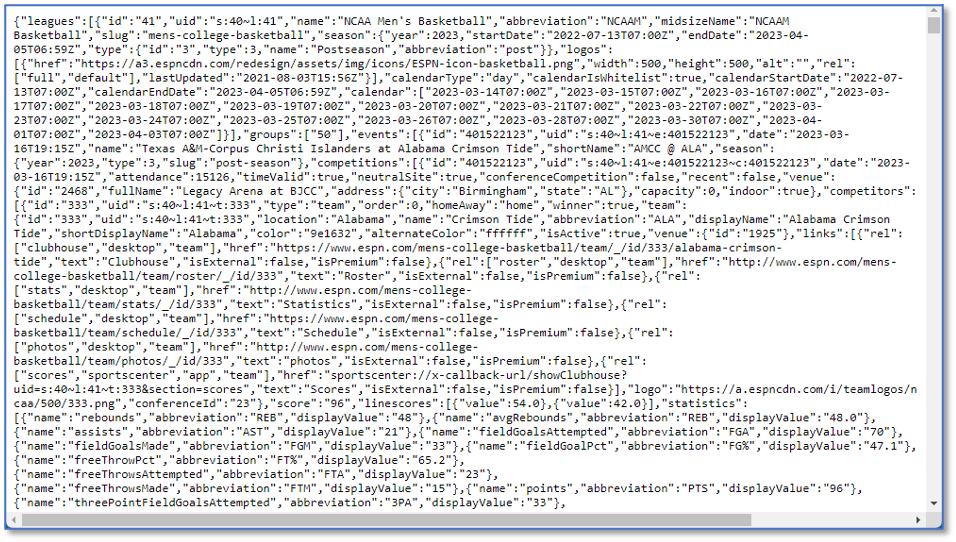
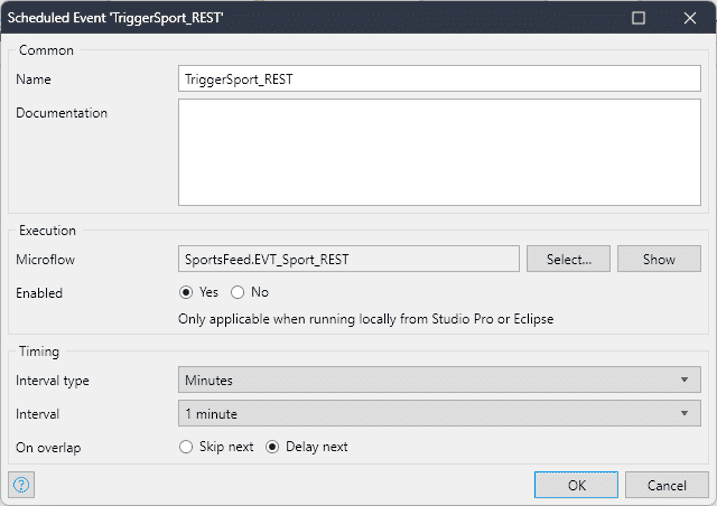
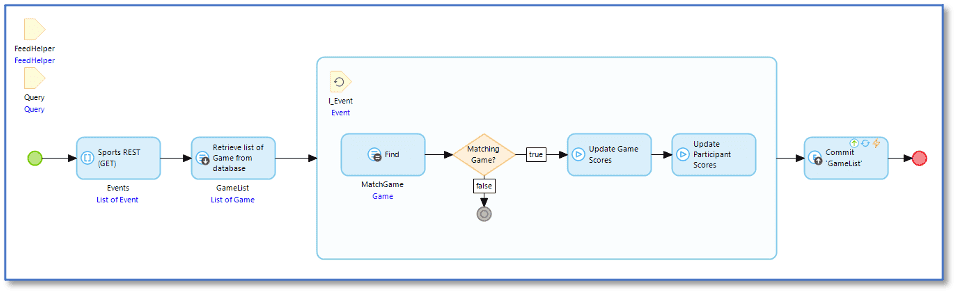
Aside from the Leaderboard widget, the entire app was built without any code. Everything started with the Sports Feed API. We would need a way to invoke it at regular intervals. To do this, a Scheduled Event (TriggerSport_REST) called a microflow EVT_Sport_REST (Figure 2) once a minute.
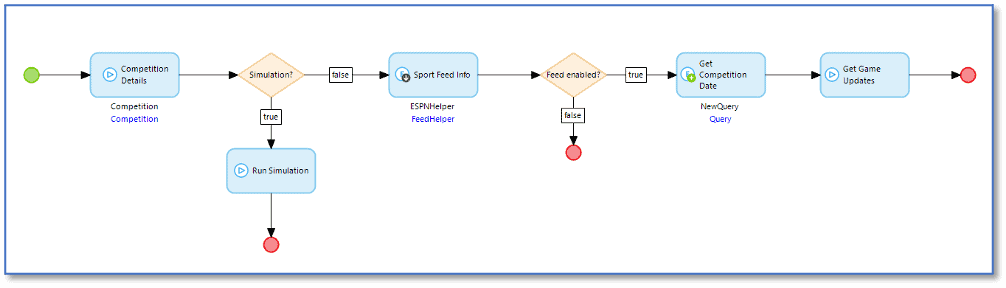
This microflow (Figure 2) determines if the app is in Simulation mode (more on that later), and if not, is the Sports Feed active? If so, another microflow (Figure 3) was called that executed the Sports Feed REST call. The response is used to update the game scores as well, and also calculate the Participant predictions scores.
The Fun
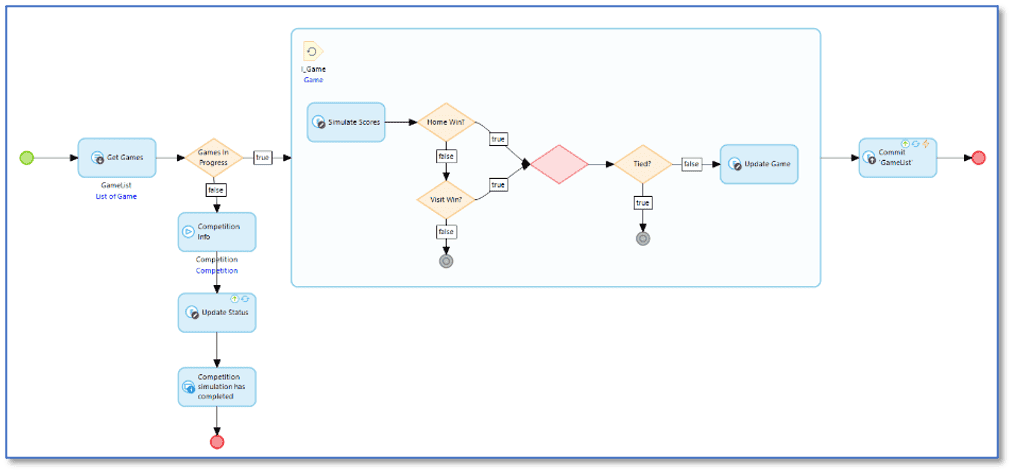
Early on, we learned that a way to simulate game activity was needed to properly test the app. A quick microflow to generate some random game scores was used. If the app is in Simulation mode (set from an admin screen) then this microflow is called instead of the Sports Feed API.
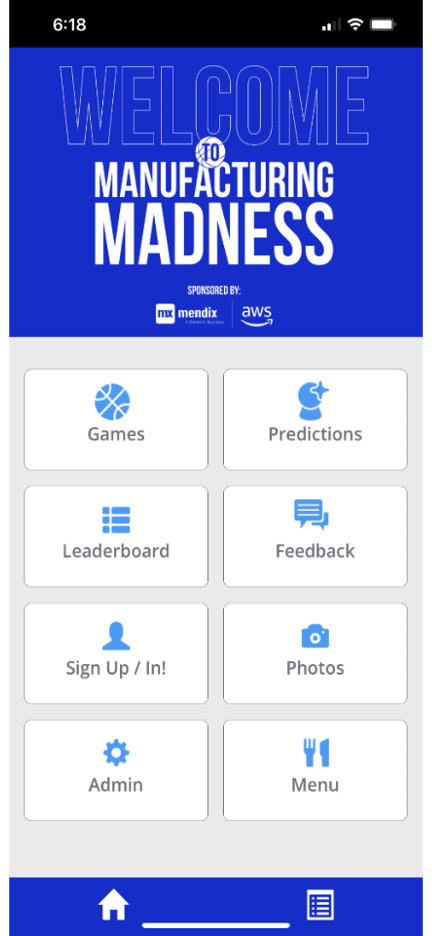
The App
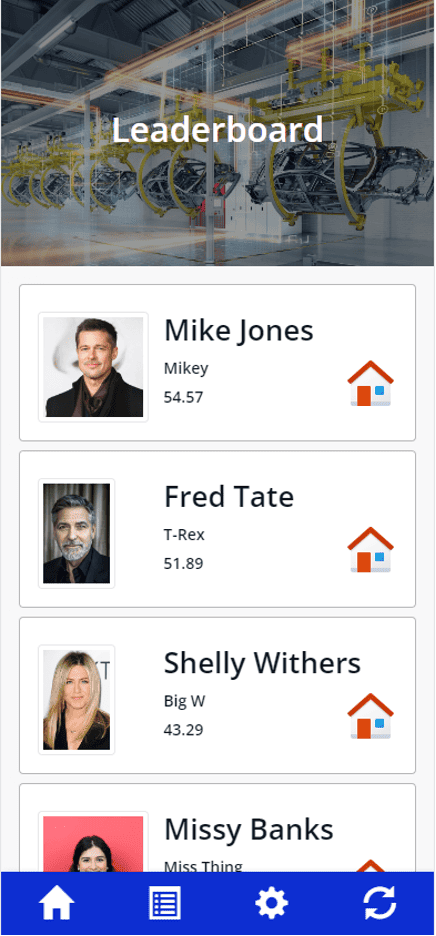
Here is the main screen where a user can register, make predictions on games, view game status as well as see the leaderboard of participant scores.
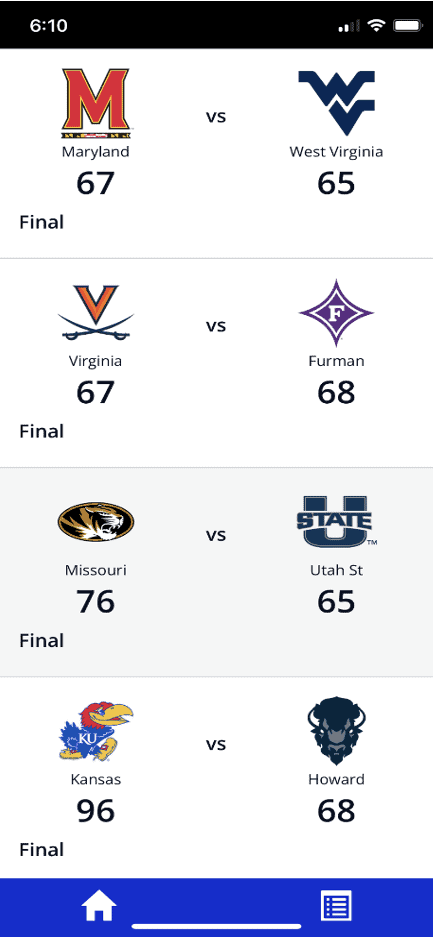
Here is the view of the games being played, the scores, and the game status:
This is the leaderboard of participants and their cumulative scores.
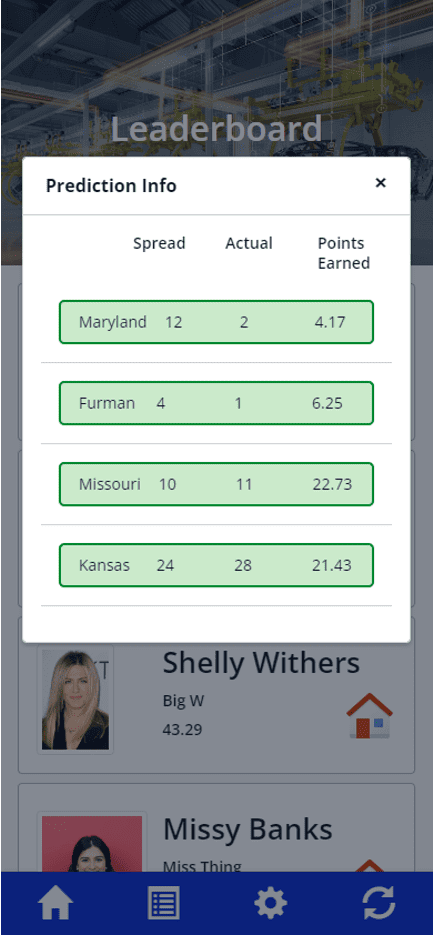
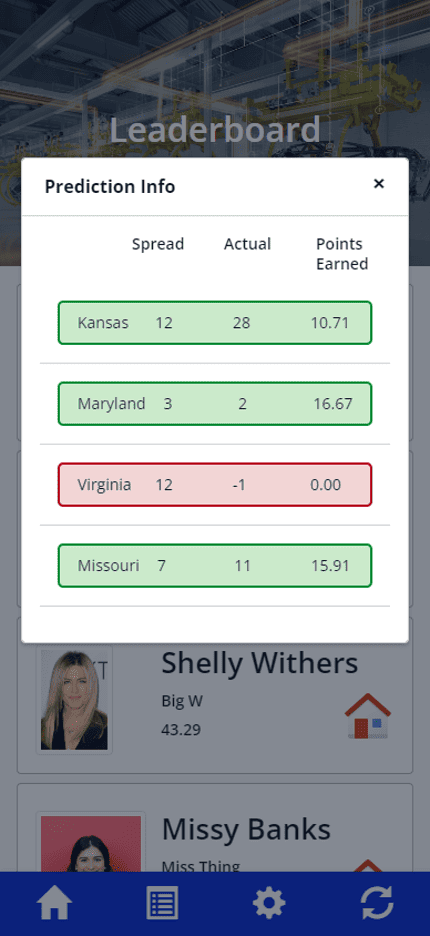
We can also view all the game predictions that contributed to the participant’s score.
Final Thoughts
This was a great project that added to the customer event for fun and participation. If you want to explore it yourself and learn how you can put an actionable app on top of an API you have, download the project file from here.